Case study · Cox Automotive
From Data Nobody Trusted to the Most-Requested Demo at NADA
Challenge
Cox Automotive set out to unify reporting across its dealer management system (DMS). Dealers exported everything to Excel to re-check the numbers, and two earlier attempts had already missed.
Action
I insisted on research, then lived at dealerships: on-site discovery and validation across a dozen regions, with dealer-group CFOs, controllers, fixed ops, parts, and service leaders. I reframed the work from "consolidate and visualize the data" to "earn dealer trust in the numbers."
Impact
The rebuilt first section, 10–12 reports, was the most requested demo at NADA 2020. At the controllers' conference a few months earlier, controllers lined up for demos to test it with their hardest questions.
prior attempts had failed before I joined
Contextdealership partners spanning 200+ rooftops (a conservative count)
Countregions across the US for on-site research
Countmost-requested demo at NADA 2020, reported by the demo lead and leadership
Reportedreports in the first section
Count- Organization
- Cox Automotive (Dealertrack), DMS reporting suite, later rolled into Cox's broader DMS modernization efforts
- Reporting
- First to a UX director, then to the VP of Product. My closest partner was the senior director who led Critical Analytics, an industry specialist with more years in automotive than I had.
- Team
- A senior designer on visual and interaction design while I handled UX architecture and research. Partners: product, engineering, implementation, marketing, and the reporting specialists who ran the legacy reports.
- Timeframe
- October 2018 to the NADA debut, February 2020
The Challenge
Dealers exported everything to Excel just to re-check the numbers. Trust was low because the data didn't reliably connect. The product team arrived with a proposed solution, but it didn't address the fragmented experience dealers were actually struggling with.
It had already failed twice, both times from not building what users needed. The first attempt skipped research entirely, built on what leadership assumed ("we know our users, so we don't need research"). The second, an earlier UX effort, led with graphs and visuals, imposing a design vision on dealers' workflow. Dealers didn't need charts first. They needed the final number and how it was reached. Neither landed.
The real problem wasn't visualization. It was trust: dealers couldn't see how the numbers totaled up, so they didn't believe the data.
Mandate: Turn a twice-failed reporting effort into something dealers trust, by putting the user back at the center.
My Role
- Led the initiative as UX Architect, owning UX architecture, all research (discovery and validation), QA review, and dealer engagement end to end
- Took ownership of a twice-failed effort and reset it around user-centered design
- Reframed the mandate from "consolidate and visualize the data" to "earn dealer trust in the numbers"
- Insisted on research; my partner, the industry-specialist senior director, quickly saw its value and backed it
- Partnered closely with three CFOs from two dealer groups, including one who trains controllers and CFOs nationally
- Built the cross-functional partnership with implementation, marketing, and the legacy reporting specialists
Approach
Research
- Led what my product partners called Dealertrack's first concerted dealer outreach as a core part of UX, moving UX beyond UI
- Owned all research, quantitative and qualitative: interviews, usability, A/B testing, task completion, and discoverability studies
- Built a national dealer research network, 50+ dealership partners (dealer groups and single-location stores) spanning 200+ rooftops, for betas, usability, A/B testing, and qualitative research. I went well beyond scheduled research: I called, emailed, and texted dealers, and stopped at dealerships on vacation or when picking up a friend's car to ask questions.
- Iterated through continuous feedback and a "Voice of the Dealership" advisory panel
- Ran on-site ethnographic research, discovery, and validation in Chicago, Los Angeles, San Jose, Northern California, Portland, Denver, Utah, Arizona, Texas (mostly greater Dallas), Atlanta, Florida, and New York
- Worked directly with dealer principals and owners, CFOs and controllers, fixed ops directors, and parts and service managers across many rooftops
- Attended Cox's annual CFO and controller accounting workshop, and recruited A/R and A/P staff there who later gave feedback
Validate as we go, not at the end
The plan was to build the whole suite, then show it. I pushed not to risk everything on one reveal. Without calling them sprints, I ran quick cycles: kept calling and visiting dealers, built journey maps of how the numbers actually flowed, tested those maps, then tested the UI. My partner soon saw the value, and validation became how the work moved. A designer worked with me on the designs while I led discovery, validation, and the dealer network.
Define
- Dealers need the final number and the path to it. Automotive retail runs on rules other industries don't have: OEM versus dealer advertising, third-party service contracts, warranties, and state service and lemon laws. Every number had to drill down to show how it was reached.
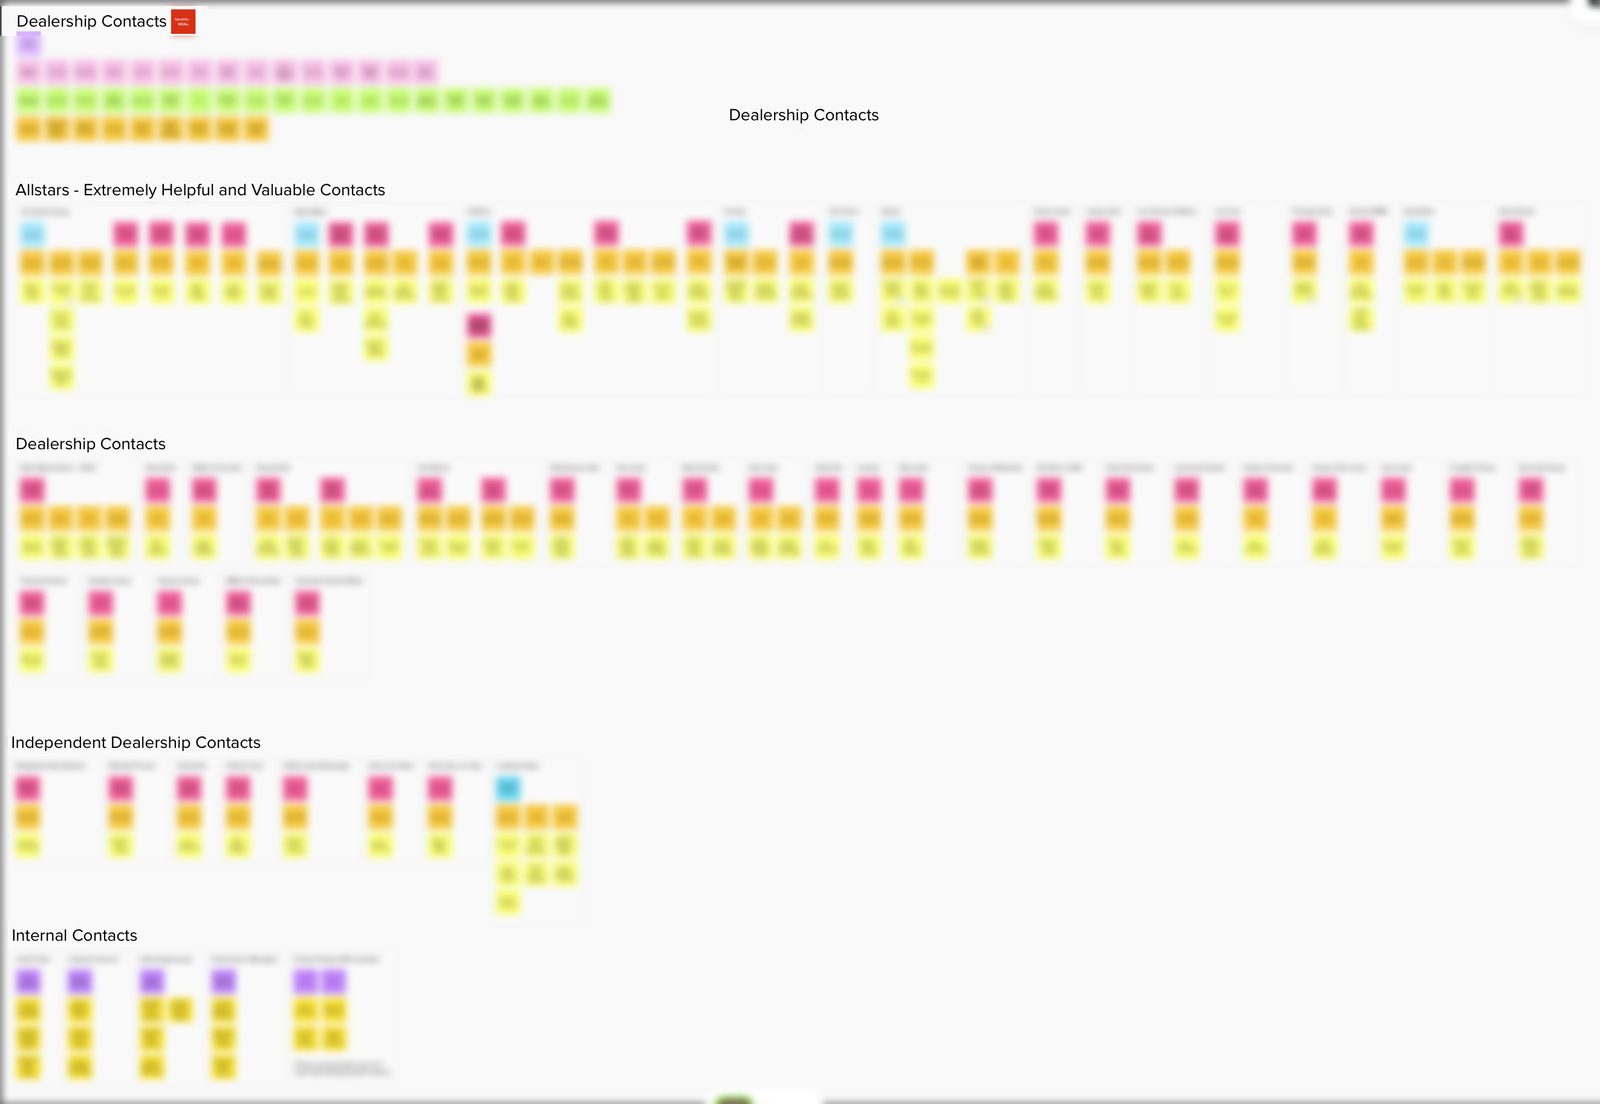
- Aligned every report to dealers' jobs to be done and their key journeys, the journey-centric approach I'd been pushing for years
- Grounded the system in the Twenty Group reports, plus the full data Cox Automotive and the DMS could bring
- Defined role-based personas and reporting goals: Controller, F&I, Service, Store/GM, Sales, Parts, Fixed Ops. Each was mapped to the metrics and drill-downs they run on (PVR, penetration, net profit, RO count), from department to team to individual, day to month to year to date, and KPI to root cause.
Design
- Built a new visual design language and a unified reporting framework: standardized filters, visualizations, and export flows across products
- Shifted reports from static data dumps to decision-support tools: drill-downs, peer benchmarking, anomaly detection, persona-specific insights
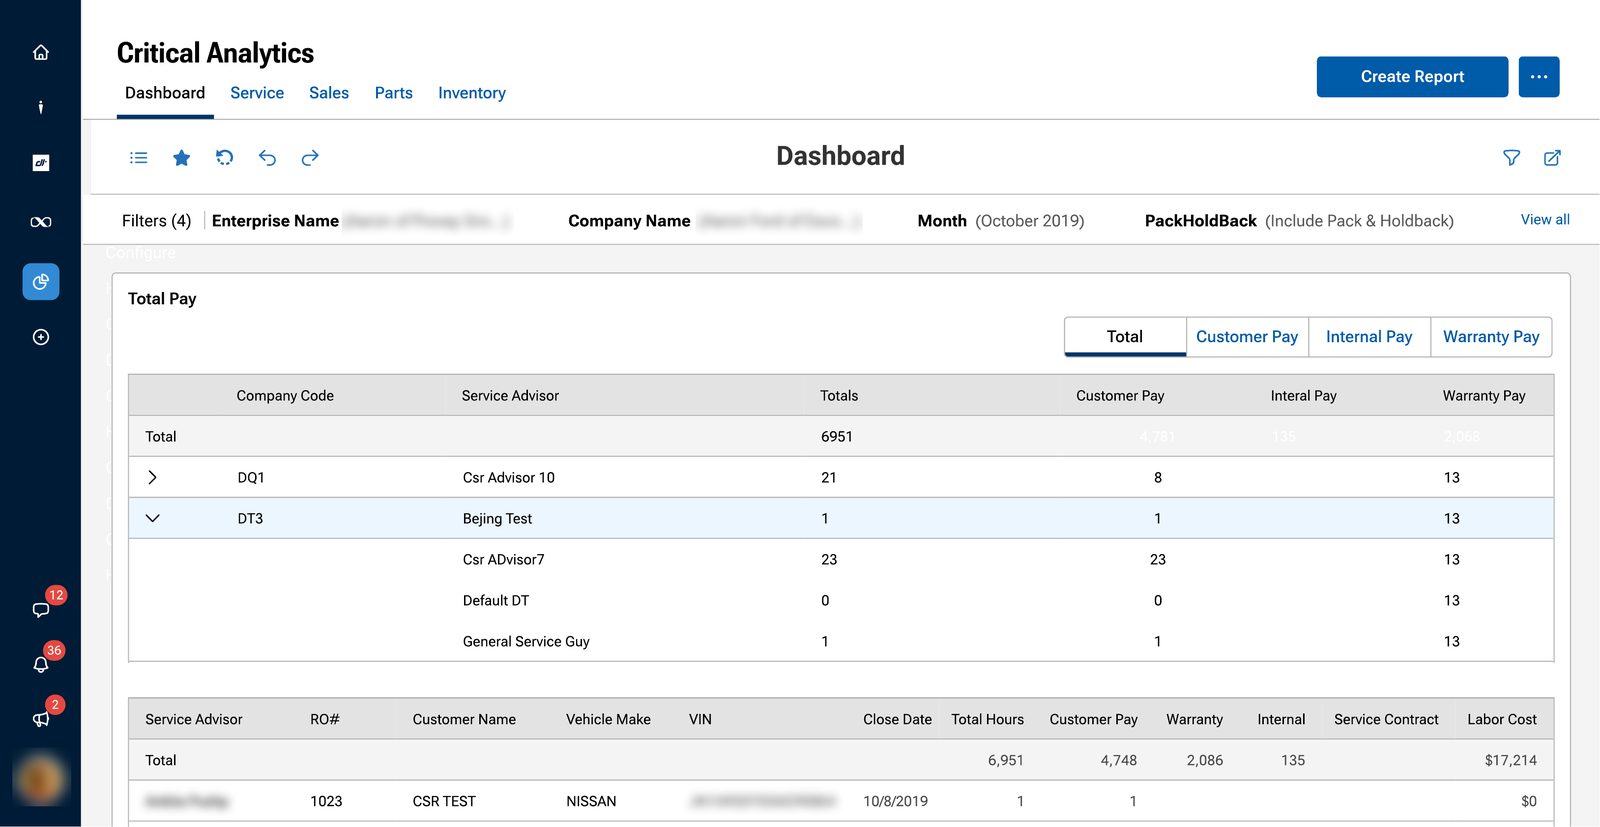
- Solved the core challenge: data presented so it reconciled to the dealer mental model and visibly totaled up
Key Artifact
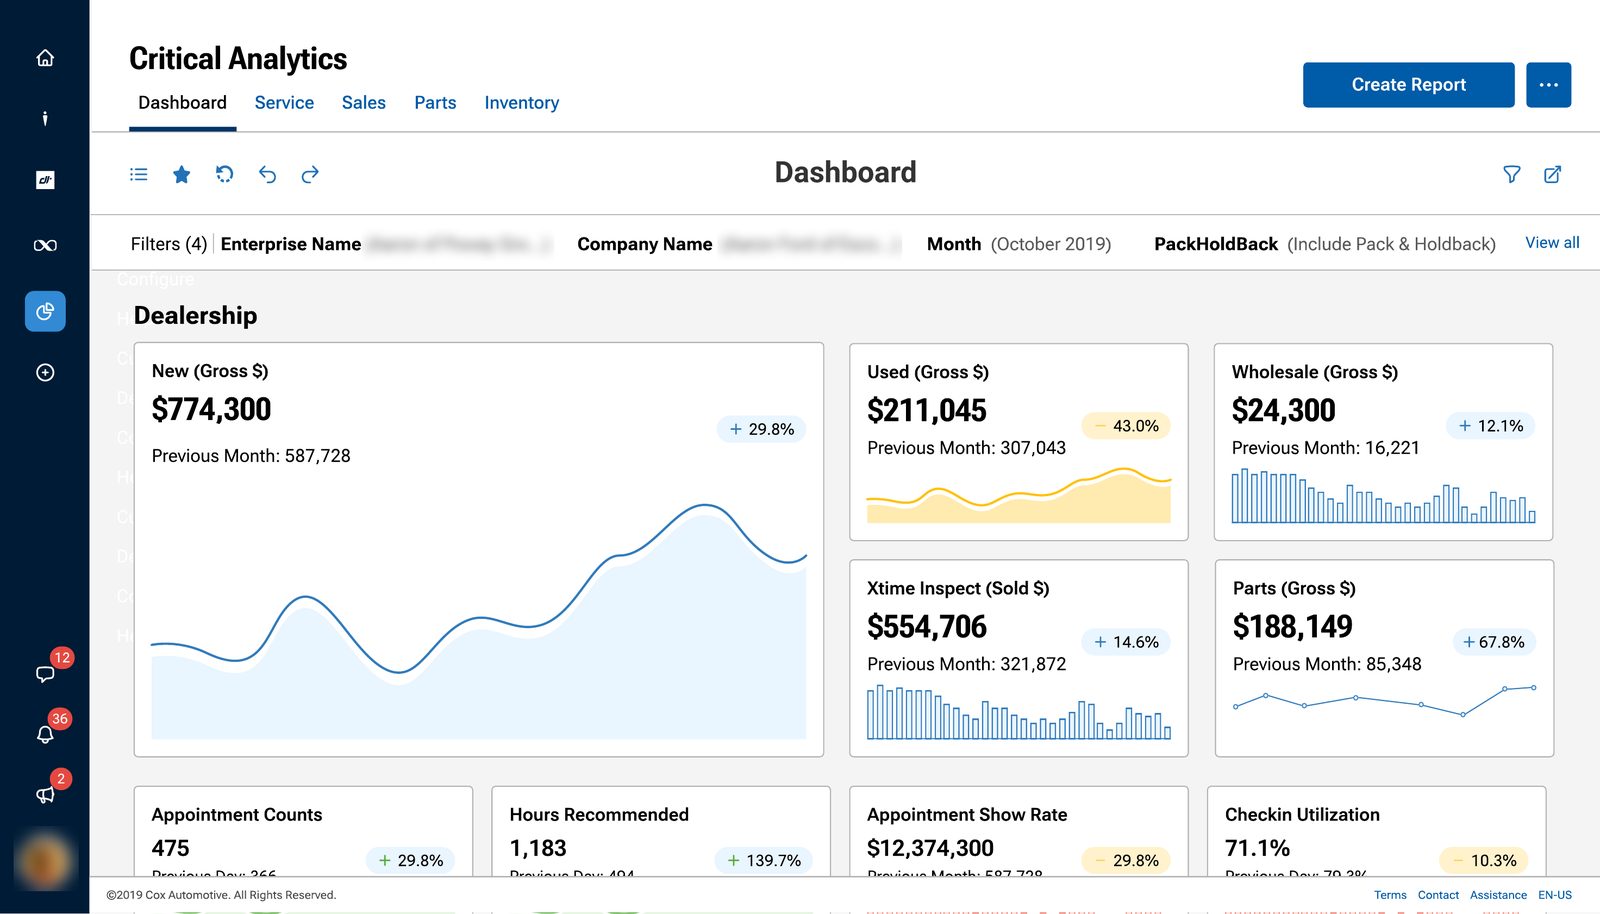
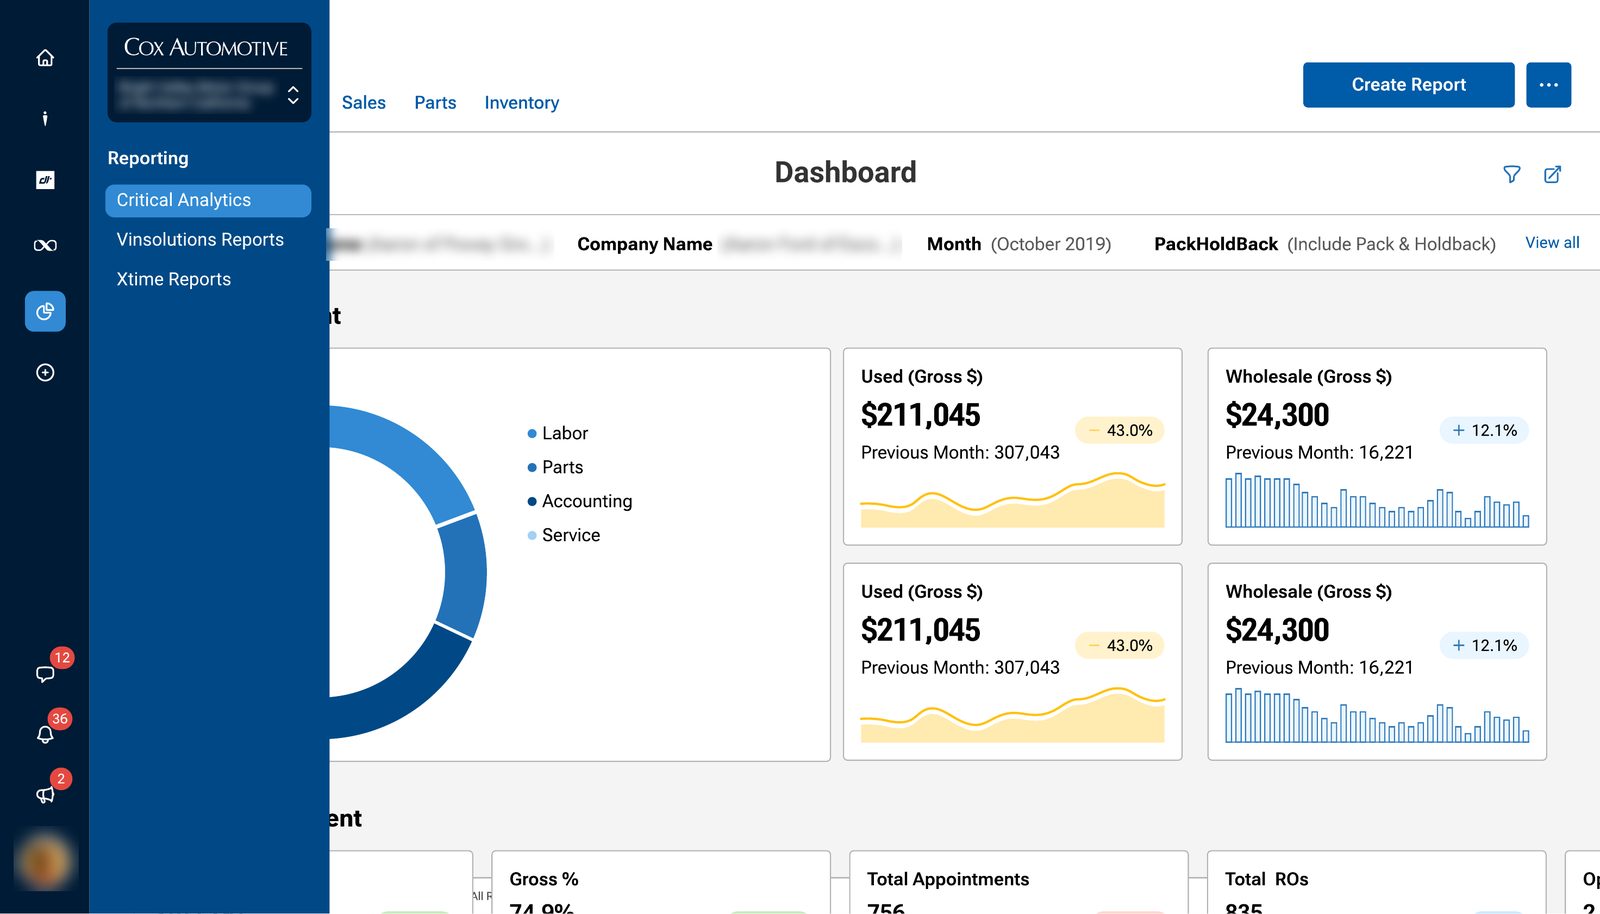
The designs
Design mocks from 2019, built on test data. Dealer and person names are blurred.
Results & Impact
- At Cox's controllers' conference in November 2019, I watched controllers line up for demos with their toughest "gotcha" questions
- Most requested demo at NADA 2020: the first section of 10–12 reports, praised by our dealer partners and the dealer groups who saw it
- A twice-failed effort became a user-validated product. Technical debt was part of the challenge and some data was still being fixed, but when the demo lead showed the tool and explained what was still being finished, dealers' eyes lit up. It was one of the best receptions I'd seen for any product I'd worked on.
- The dealer network drove all my work at Cox: as an architect, I made sure, with my partners, that the voice of the customer shaped every decision
- Set the design language, persona framework, and reporting standards for v1
Reflection
What I'd do differently
Secure sponsorship beyond your partner. Up to NADA 2020, the approach worked: research earned my partner's trust, dealers validated the reports, and the demo drew the most requests at the show. After that, leadership and platform direction changed. A product can win with users and still be reshaped by decisions made above it. Now I build executive sponsorship beyond my direct partner before launch, so the evidence behind the work outlives any one champion.